Top Chart Patterns For Crypto Trading
Crypto markets fluctuate wildly. Beginners often feel overwhelmed. Technical analysis offers a lifeline. It helps spot patterns in price action. In 2025, crypto adoption surges. Stablecoins and institutional interest grow. This makes TA more relevant than ever. Why now? Volatility demands tools for smart decisions. This article teaches key strategies. Focus on candlestick patterns, RSI, and MACD. Use examples from altcoins like Chainlink. Build your skills step by step.
Understanding Technical Analysis Basics
Technical analysis studies past prices. It forecasts future trends. Charts are the main tool. Prices reflect all known info. History tends to repeat. However, TA is not crystal ball magic. It deals in probabilities.
Think of TA as a roadmap. It shows where the road might bend. For crypto, this matters. Markets trade 24/7. No weekends off.
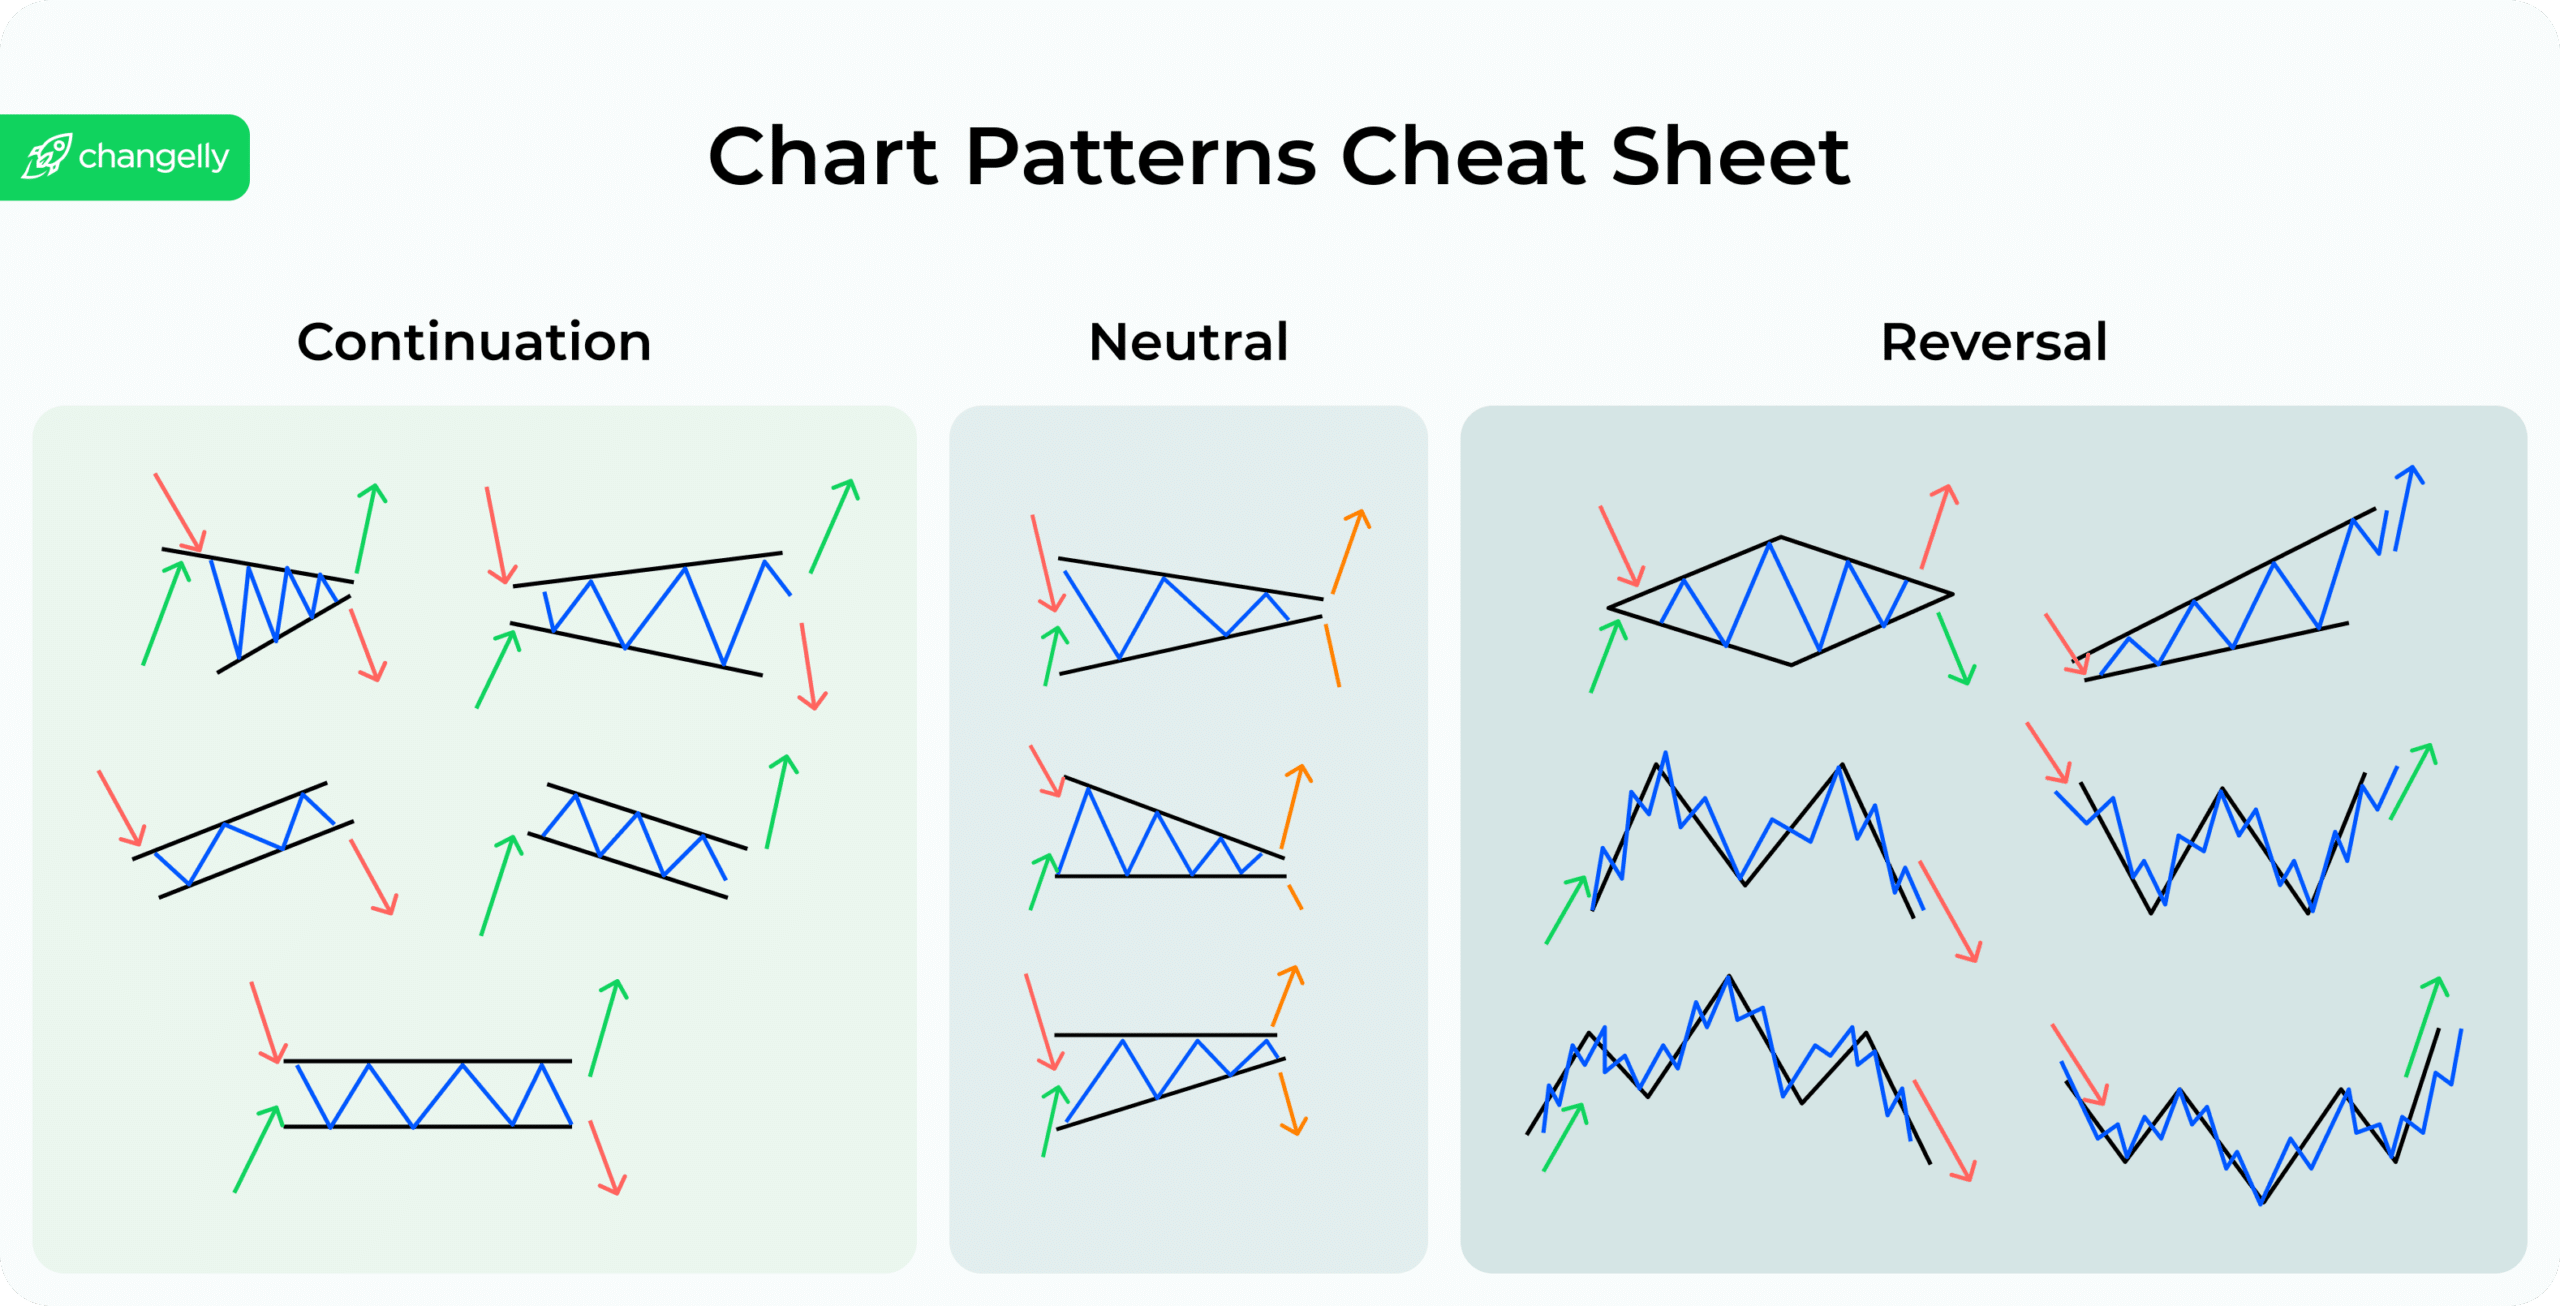
Candlestick Patterns Explained
Candlesticks visualize price movement. Each bar has a body and wicks. Body shows open and close prices. Wicks mark high and low.
Green candles mean bullish. Close higher than open. Red means bearish. Simple, right?
Common patterns signal changes. Doji looks like a cross. It shows indecision. Buyers and sellers tie.
Hammer has a small body. Long lower wick. It suggests reversal up. Like a hammer nailing the bottom.
Shooting star is opposite. Small body, long upper wick. Signals potential drop.
For example, in Chainlink (LINK), a hammer formed in late November 2025. Price bounced from $12.50 support. This led to a 5% rise in days. Altcoins like LINK often show clear patterns. Volatility amplifies them.

Essential Candlestick Patterns for Crypto Traders – altFINS
Another example from Solana. A doji appeared mid-2025. Price hovered at $150. Indecision preceded a breakout.
Practice spotting these. Use free charts on TradingView.
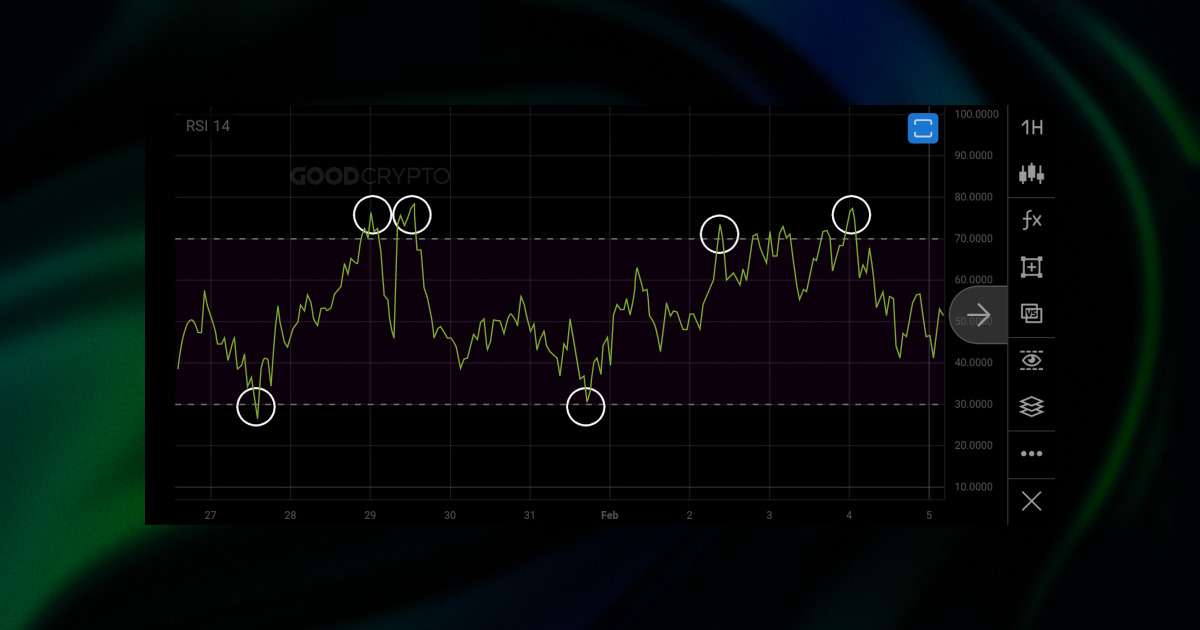
RSI: Gauging Momentum Strength
RSI stands for Relative Strength Index. It measures price change speed. Scale runs from 0 to 100.
Above 70? Overbought. Price may fall soon. Below 30? Oversold. Bounce likely.
Analogy: Imagine a rubber band. Stretch too far, it snaps back.
In crypto, RSI shines. Markets overreact often.
Take Chainlink again. In October 2025, RSI hit 75. Price was $15. Correction followed to $13. This signaled sell opportunity.
For Cardano (ADA), RSI dipped to 25 in summer 2025. Price rebounded 10%.
Divergence adds power. Price highs, but RSI lowers? Bearish sign.
Relative Strength Index (RSI) Indicator for Crypto Trading
Combine with other tools. RSI alone can mislead.
MACD: Tracking Trend Changes
MACD means Moving Average Convergence Divergence. It uses two lines. MACD line and signal line. Histogram shows difference.
Crossover up? Buy signal. MACD crosses above signal.
Crossover down? Sell.
Analogy: Traffic lights. Green for go, red for stop.
In altcoins, MACD spots momentum shifts.
Example: Solana in September 2025. MACD crossed up at $140. Price climbed to $160.
For Chainlink, a bearish crossover in December 2025 warned of drop. Price fell from $13.50 to $12.55.
Histogram fading? Trend weakens.
:max_bytes(150000):strip_icc()/dotdash_Final_Moving_Average_Convergence_Divergence_MACD_Aug_2020-02-58bf5e34f0f94730b6e2d56ef9032b6d.jpg)
What Is MACD?
Use default settings first. 12, 26, 9 periods.
Current Trends in Crypto Technical Analysis
2025 brings changes. Markets show bearish pressure year-end. Diversification reduces risk.
AI integrates with TA. Automated tools scan patterns.
Adoption grows globally. India and US lead.
For altcoins, real-world data matters. Chainlink’s oracles enable this. They feed external info to smart contracts. Prices become reliable. No manipulation risks. This boosts TA accuracy. For instance, weather data triggers insurance payouts. LINK powers thousands of contracts. Its price reflects utility.
In 2025, oracles expand to AI and DeFi. Watch for spikes.
Pros of Using TA in Crypto
TA improves timing. Spot entries and exits.
Visual tools engage users.
Works well in volatile assets.
Data shows impact. 89% of day traders use TA.
Builds discipline. Follow rules, not emotions.
Risks and Common Pitfalls
Markets can ignore patterns. Black swans happen.
TA overlooks news. Fundamentals still count.
Over-reliance leads to losses. Only 30% traders profit.
False signals common in crypto.
Avoid curve-fitting. Past data tricks.
Busting TA Misconceptions
TA predicts future exactly? No. It offers edges.
Only for pros? Beginners can learn fast.
Useless in bull markets? No. Helps manage risks.
Combine with sentiment. X posts reveal hype.
Actionable Insights for Beginners
Start simple. Pick one indicator.
Use demo accounts. Practice without risk.
Watch RSI for extremes. Avoid buying overbought.
Scan candlesticks daily. Note patterns in LINK or SOL.
For MACD, wait for confirmations. Volume helps.
Track news on oracles. Chainlink updates move price.
Set stop-losses always. Protect capital.
Join communities. Learn from others.
For visual aid, check this infographic.
Top 10 Crypto/Blockchain Infographics You Must Know
Boost learning with videos. Watch this beginner tutorial: https://www.youtube.com/watch?v=40fP_iKaK1I
Wrapping Up: A Long-Term View
Technical analysis empowers traders. It turns chaos into strategy. Master basics first. Candlesticks, RSI, MACD form the core. Altcoins provide real examples. Chainlink shows utility beyond trading.
Remember, patience wins. Crypto evolves. Combine TA with research. Long-term success comes from consistency.
What indicator will you test in your next trade?
(Note: This is not financial advice. Crypto is volatile; always DYOR and only invest what you can afford to lose.)