Short answer: By mid-December 2025, XRP had dropped 45% from its July 2025 high of $3.66 down to around $1.92, leaving roughly 37-42% of holder addresses underwater on their original entry price. The Crypto Fear and Greed Index sat at 17 — deep in extreme fear territory — while whales sold off 1.2 billion tokens even as technical indicators like the TD Sequential flashed potential buy signals. The setup captured a classic tension in crypto downturns: real pain for existing holders alongside signals some traders read as a possible bottom.

The Sharp Decline That Gripped XRP Investors
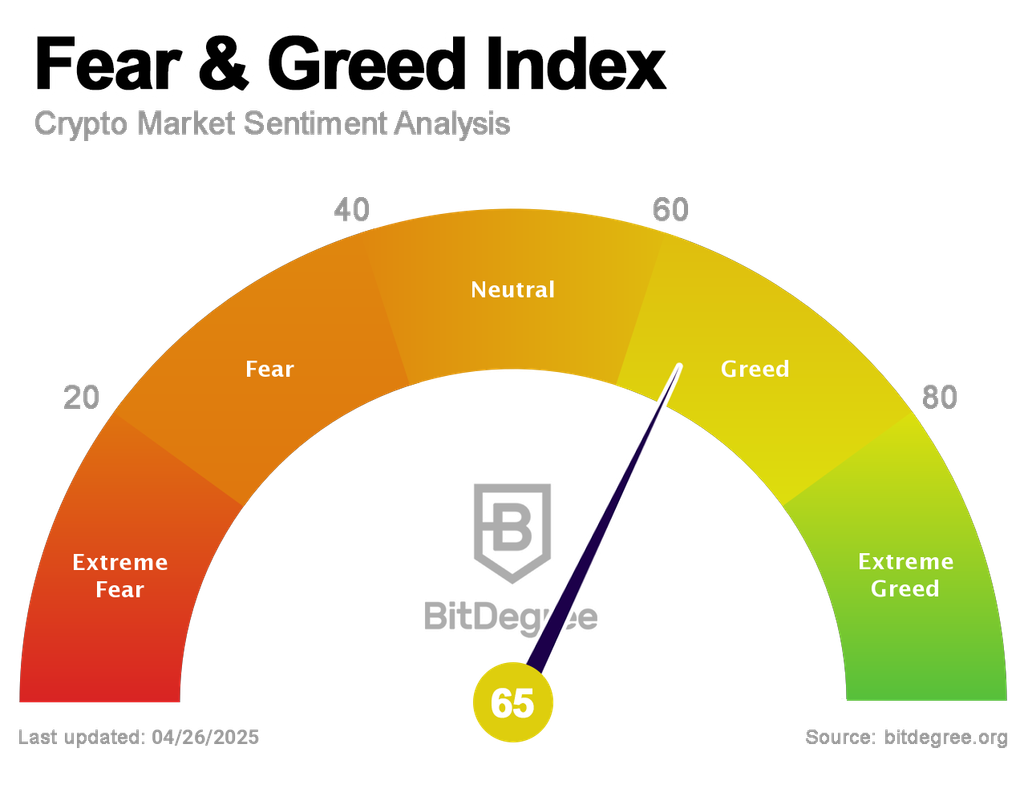
XRP, the native token of the Ripple network, endured a genuinely brutal correction heading into that December. From its recent high of $3.66 in July 2025, the price plummeted to around $1.92, marking a 45% drop that left many holders reeling. That slide pushed sentiment into extreme fear territory, with the Crypto Fear and Greed Index hovering at 17 — a level that signaled widespread panic across the market.
The moment mattered because, in the fast-paced world of digital assets, downturns like this one often mark meaningful turning points one way or another. For curious investors and crypto beginners alike, understanding XRP’s predicament at the time offered real insight into how broader market cycles actually play out on the ground. Fund managers and serious retail investors were watching closely too, given XRP’s role in cross-border payments made it something of a bellwether for fintech adoption more broadly. With 37% of holders underwater — meaning their entry price exceeded the token’s current value — the question at the time was straightforward: was this the bottom, or just a pause in a longer descent?
Understanding “Underwater” Holdings
In cryptocurrency investing, being “underwater” is a lot like owning a house whose market value has fallen below what you originally paid for it. For XRP holders in this stretch, that meant the average cost basis for a significant portion of addresses sat higher than the token’s current price. On-chain analytics at the time showed approximately 42% of XRP addresses in loss positions — a figure that underscored just how much pain the recent volatility had inflicted. This kind of metric gets derived by tracking wallet addresses against their historical transaction costs, offering a genuine window into investor resilience under pressure.
Think of it like a ship taking on water: some passengers — short-term traders — jump ship quickly, while others, the long-term holders, batten down the hatches and ride it out. In XRP’s case, this underwater percentage rose sharply amid the broader crypto market correction happening at the same time. For beginners, it’s a useful reminder that crypto isn’t just about price charts — it’s also about the distribution of holdings and how that distribution influences supply and demand dynamics going forward. Tools like Glassnode or Santiment track these kinds of metrics, helping investors gauge whether panic selling has run its course or is only just beginning.
Whale Movements, Sentiment, and Seasonal Patterns
XRP’s trends during this stretch painted a picture of genuinely contrasting forces. On one hand, large holders — whales — were offloading significant amounts of supply. Between late November and mid-December 2025, whales sold off 1.2 billion XRP, reducing their collective holdings from 4.8 billion down to 3.6 billion tokens. This wave of profit-taking exacerbated the price drop, as these large players locked in gains from earlier rallies rather than holding through the correction.
Conversely, some long-term holders appeared to be accumulating during the same window. Data indicated that mid-sized whales absorbed a meaningful share of the selling pressure, with over 350 million XRP changing hands in a single week amid the downturn. This dynamic suggested a transfer of tokens from weaker to stronger hands — a pattern that has historically been a common precursor to stabilization in crypto markets, though not a guaranteed one.
Sentiment remained a key driver throughout. The Crypto Fear and Greed Index, which aggregates factors like volatility and social media activity, sat deep in extreme fear at 16-17 during this period. Historically, lows this severe have sometimes preceded rebounds, since extreme fear often signals genuinely oversold conditions rather than a rational reassessment of fundamentals.
Adding useful context, historical December patterns for XRP have been decidedly mixed over the years. Over the past decade, Decembers have seen strong gains in some years — like a 200% surge in 2017 amid that year’s bull market — but sharp losses in others, such as a 30% dip in 2020 during a period of regulatory uncertainty. This seasonality reflects broader crypto market tendencies, where year-end tax-loss harvesting and thinner holiday liquidity can amplify price moves in either direction. With XRP down 7.4% weekly in early December 2025, the pattern at the time leaned cautious, though not uniformly bearish.
Pros, Risks, and Common Misconceptions
The case for viewing this as a bottom was fairly compelling on its own terms. Technical indicators like the TD Sequential were flashing buy signals on weekly charts at the time, hinting at a potential reversal. This particular tool, which identifies exhaustion within a trend, has a solid track record of spotting oversold conditions in assets like Bitcoin and Ethereum historically. For XRP, a signal near $2.09 aligned with institutional inflows, including over $1 billion into XRP ETFs despite the broader price slump. Ripple’s ongoing expansions in fintech — including partnerships for stablecoin integrations — also bolstered the token’s underlying utility case beyond pure speculation.
Real risks remained alongside those positives, though. A further market-wide crash, driven by macroeconomic factors like interest rate moves or unexpected regulatory setbacks, could have pushed XRP below $1.50. Whale dumping continued weighing on liquidity, and if sentiment failed to shift, the 45% drop had genuine potential to extend to 60% or more, mirroring patterns seen in past bear cycles.
A few misconceptions are worth addressing directly. Extreme fear doesn’t always mean an immediate bottom — markets can remain irrational for far longer than seems reasonable, and XRP itself lingered in fear zones for months during 2022 before eventually recovering. Whale selling isn’t purely bearish either; it’s often just profit-taking that ends up setting the stage for new buyers to step in. And many investors overlooked XRP’s remaining ties to broader regulatory risk, assuming the 2023 SEC settlement had erased all uncertainty, when global regulations outside the U.S. still posed genuine hurdles.
Actionable Insights for Investors
For investors evaluating similar setups, monitoring a handful of key indicators helps cut through the noise. Tracking the TD Sequential for confirmation of a relief rally is one approach — a green “9” setup has historically preceded 10-20% bounces in various assets. Watching whale wallets through tools like Whale Alert offers another angle; if accumulation starts outpacing selling, it can signal underlying strength building beneath the surface.
Considering the broader context matters too — XRP’s integration into digital asset infrastructure like tokenized payments positioned it well for continued fintech growth regardless of short-term price action. Comparing it against peers like Stellar, which shares similar payment-focused use cases but lacks Ripple’s enterprise focus, can also offer useful perspective on relative positioning.
Thinking long-term matters most here: if holding through a drawdown like this, assessing your cost basis against the asset’s actual utility case makes more sense than reacting to daily price swings. For new entries during fear phases specifically, dollar-cost averaging has historically outperformed lump-sum buying in volatile assets over multi-year horizons. Keeping an eye on ETF flows and regulatory news from bodies like the CFTC also helps, since positive developments have repeatedly acted as catalysts for upside moves. Diversifying broadly matters too — XRP’s correlation with Bitcoin means wider crypto exposure can help mitigate concentrated risk.
Frequently Asked Questions
What does it mean to be “underwater” on a crypto holding?
Being underwater means an investor’s average purchase price is higher than the asset’s current market value. In December 2025, on-chain data showed roughly 37-42% of XRP addresses held tokens at a loss relative to their original cost basis.
What is the TD Sequential indicator?
The TD Sequential is a technical analysis tool that identifies exhaustion within a price trend, often flagging potential reversal points. A “9” setup on this indicator has historically preceded relief rallies in assets like Bitcoin, Ethereum, and XRP.
Does whale selling always signal a bearish outlook?
Not necessarily. Whale selling is often simply profit-taking after a rally, and it can actually set the stage for new buyers to accumulate at lower prices, which is a common precursor to price stabilization.
Does an extreme fear reading always mean the market has bottomed?
No. Extreme fear readings on indexes like the Crypto Fear and Greed Index often precede rebounds, but markets can stay irrational for extended periods. XRP itself remained in fear territory for months during 2022 before recovering.
A Long-Term View Amid Uncertainty
XRP’s journey through this stretch reflected the essence of crypto investing more broadly: high potential rewards tempered by genuinely sharp volatility. While the 45% drop and 37% underwater holder figure painted a grim short-term picture at the time, signals like the TD Sequential buy setup and mixed whale activity suggested potential relief was at least plausible. Ripple’s foundational role in efficient cross-border transfers remained intact throughout, positioning XRP for recovery as global fintech infrastructure continued evolving around it.
In the end, markets have tended to reward patience over panic more often than not. As XRP navigated this particular trough, the more useful focus for investors was on underlying fundamentals rather than fleeting day-to-day sentiment.
Looking back, did the relief rally that traders anticipated actually materialize, or did more pain follow for holders in the months after? That’s a question worth revisiting against the actual price history rather than speculating further here.
This is not financial advice. Crypto is volatile — always do your own research and only invest what you can afford to lose.