The history and evolution of Bitcoin began on January 3, 2009, when an anonymous creator known as Satoshi Nakamoto mined the genesis block

The History and Evolution of Bitcoin: From 2009 to 2026 Timeline of Key Milestones, Halvings, Adoption Growth, and Lessons Learned—Original Narrative with Data Charts
The history and evolution of Bitcoin began on January 3, 2009, when an anonymous creator known as Satoshi Nakamoto mined the genesis block, embedding a headline from The Times newspaper about bank bailouts. This act symbolized a rebellion against traditional finance amid the 2008 crisis. Today, in 2026, Bitcoin stands as a trillion-dollar asset class, influencing global economies and sparking debates on monetary policy. Understanding this journey matters now more than ever, as institutional adoption accelerates and regulatory frameworks solidify, potentially reshaping how we store value in an increasingly digital world.
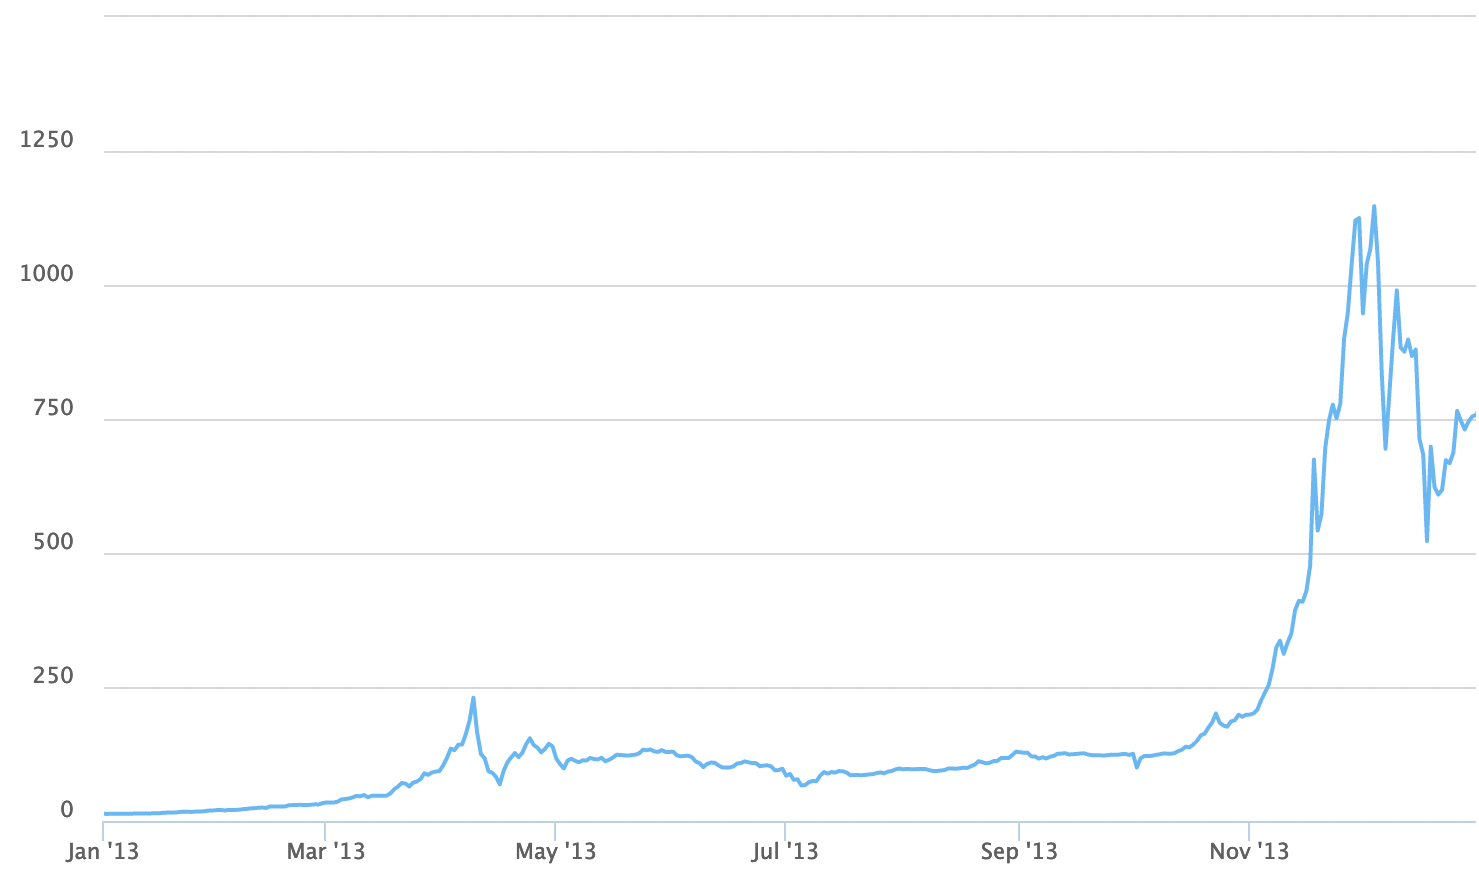
Bitcoin Price History Chart (2009, 2010 to 2025)
Why Bitcoin’s Origins Still Resonate Today
Bitcoin emerged from the ashes of the financial meltdown. Satoshi’s whitepaper, published in October 2008, proposed a peer-to-peer electronic cash system free from central authorities. It solved the double-spending problem through blockchain—a distributed ledger secured by cryptography. Like inventing email in a world of postal mail, Bitcoin offered instant, borderless transfers without intermediaries.
However, its early days were humble. In 2009, Bitcoin had no monetary value. Enthusiasts mined it on personal computers, drawn to the idea rather than profit. By 2010, the first real-world transaction occurred: 10,000 BTC for two pizzas, now worth billions. This pizza day milestone highlighted Bitcoin’s potential as currency, yet it also underscored its volatility.
As we reflect in 2026, these foundations explain Bitcoin’s resilience. Amid ongoing economic uncertainties—like inflation spikes and geopolitical tensions—Bitcoin serves as “digital gold,” a hedge with a fixed supply of 21 million coins.
Breaking Down the Core Concepts in the History and Evolution of Bitcoin
At its heart, Bitcoin is a decentralized network. Miners validate transactions using proof-of-work, consuming energy to solve puzzles and add blocks to the chain. This process ensures security but has drawn criticism for environmental impact.
Halvings are pivotal in Bitcoin’s design. Every 210,000 blocks—roughly four years—the mining reward halves, reducing new supply. The first halving in November 2012 dropped rewards from 50 to 25 BTC. Subsequent ones followed in July 2016 (to 12.5 BTC), May 2020 (to 6.25 BTC), and April 2024 (to 3.125 BTC). These events mimic gold’s scarcity, often correlating with price surges due to supply shocks.
Adoption growth tells another story. From niche forums to mainstream finance, Bitcoin’s user base exploded. By 2026, global crypto adoption hits 9.9%, with 559 million users worldwide. This S-curve mirrors the internet’s rise, accelerating as infrastructure improves.
Think of Bitcoin like a startup: early adopters faced bugs and skepticism, but iterative improvements—such as the Lightning Network for faster transactions—enhanced usability.
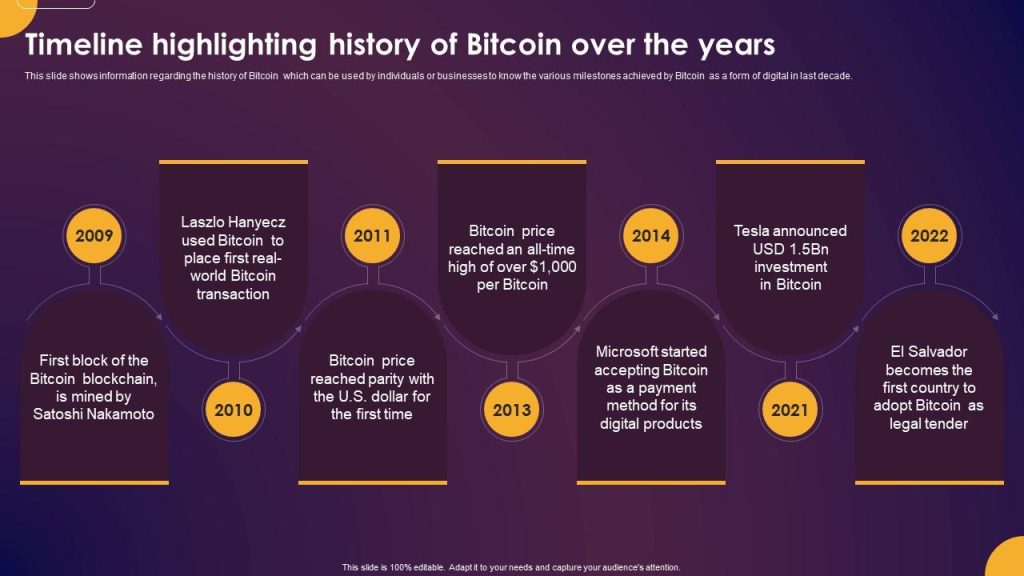
Comprehensive Guide To Understand Timeline Highlighting History
Timeline of Key Milestones in the History and Evolution of Bitcoin
Let’s trace the history and evolution of Bitcoin through its defining moments.
2009-2012: Inception and Early Struggles
- 2009: Genesis block mined. Bitcoin software released publicly.
- 2010: First exchange rate set at $0.00099 per BTC. Pizza day transaction.
- 2011: Price hits $1, then bubbles to $31 before crashing 94% to $2. Parity with USD sparks media interest.
- 2012: First halving. Price climbs to $13. Foundation established for regulatory advocacy.
These years built the community. Volatility was extreme, but so was innovation.
2013-2016: Boom, Bust, and Recovery
- 2013: Price surpasses $1,000 amid Cyprus banking crisis. China bans financial institutions from handling BTC, causing a dip.
- 2014: Mt. Gox hack loses 850,000 BTC, worth billions today. Price falls 58%.
- 2015: Recovery begins with improved security protocols.
- 2016: Second halving. Price doubles to around $966. Brexit and economic instability boost appeal.
This period tested Bitcoin’s durability, proving it could survive scandals.
2017-2020: Mainstream Breakthrough and Pandemic Resilience
- 2017: Bull run to nearly $20,000 fueled by ICO hype. CME launches futures, legitimizing it.
- 2018: Bear market; price drops 73% to $3,800.
- 2019: Rebound to $7,400 as Facebook announces Libra, drawing regulatory scrutiny.
- 2020: Third halving. COVID crash to $3,800, then surge to $29,000 as institutions enter.
Bitcoin’s role as a safe haven solidified during global turmoil.
2021-2023: Institutional Era and Market Corrections
- 2021: ATH at $69,000. El Salvador adopts BTC as legal tender. Tesla buys $1.5 billion worth.
- 2022: FTX collapse triggers 65% drop to $16,600. Bear market exposes overleveraged players.
- 2023: Recovery to $42,000. BlackRock files for ETF, signaling Wall Street’s embrace.
Lessons from crashes emphasized risk management.
2024-2026: Maturity and Super Cycle
- 2024: ETF approvals in January drive inflows. Fourth halving in April. Price hits $100,000 milestone.
- 2025: Peaks at $126,000 before correcting to $87,800 amid profit-taking. Nation-state adoption grows; MicroStrategy expands treasury holdings.
- 2026: As of January, price hovers around $89,000. Predictions of $150,000 by year-end, driven by lower interest rates and AI integration. Crypto market revenue projected at $95.1 billion.
The history and evolution of Bitcoin show a shift from speculative asset to strategic reserve.
Here’s a chart illustrating Bitcoin’s yearly closing prices, showcasing exponential growth despite volatility:

Current Trends and Real-World Relevance
In 2026, Bitcoin’s relevance extends beyond price. Institutional adoption surges, with firms like Galaxy Digital forecasting $250,000 by 2027. Stablecoins integrate, enabling real-world applications like remittances.
Trends include tokenization of assets and Bitcoin in national reserves. El Salvador’s success inspires others. Meanwhile, energy debates push miners toward renewables.
Adoption growth charts reveal an S-curve trajectory, faster than the internet’s.

The Cryptocurrency Adoption Curve Is The Fastest In Human History
With 559 million users, Bitcoin influences fintech, from DeFi to NFTs.
For a deeper dive, watch this documentary on Bitcoin’s rise: The Rise and Rise of Bitcoin.
Pros, Risks, and Common Misconceptions in the History and Evolution of Bitcoin
Bitcoin’s pros shine through its history: decentralization protects against censorship, scarcity combats inflation, and transparency builds trust. It empowers the unbanked, offering financial inclusion.
Yet risks abound. Volatility can wipe out gains—witness the 2022 crash. Regulatory uncertainty persists; bans in some countries hinder growth. Energy use equals some nations’, fueling environmental concerns.
Misconceptions include “Bitcoin is anonymous”—transactions are pseudonymous but traceable. Another: “It’s a Ponzi scheme.” Unlike schemes, Bitcoin has utility and no central promoter. Halvings aren’t guarantees of price spikes; market forces dominate.
Actionable Insights for Investors
Consider Bitcoin’s long-term trajectory. Watch halvings—the next in 2028 could spark rallies. Monitor adoption metrics; rising users signal strength.
Diversify, but allocate based on risk tolerance. Track institutional moves, like ETF flows. Use tools like TradingView for charts: Bitcoin Chart on TradingView.
Stay informed via sources like CoinDesk or X discussions. Remember, patience pays; early holders weathered storms.
Conclusion: A Long-Term Perspective on the History and Evolution of Bitcoin
The history and evolution of Bitcoin—from obscure experiment to global force—teach endurance. Through halvings, booms, and busts, it evolved into a mature asset. In 2026, as adoption nears 10%, Bitcoin challenges fiat systems, promising a decentralized future.
Yet, what if Bitcoin’s true revolution is just beginning—could it redefine money entirely?
Top Ten References Used for This Article
- Bitcoin’s Price History With Charts From 2009 To 2025 | Bankrate
- Bitcoin Price History Chart (2009, 2010 to 2025)
- History of bitcoin – Wikipedia
- Bitcoin’s price history (2009 – 2025) – key events and insights – Oanda
- Bitcoin Price History (2009 to 2026) – Data & Analysis
- Bitcoin’s Price History – Investopedia
- Bitcoin Price History Chart + Historical Events 2009-2026 – 99Bitcoins
- Bitcoin Halving Countdown | CoinGecko
- Global Crypto Adoption (2026): Users, Rates & Country Data
- The Year Ahead: 10 Crypto Predictions for 2026 – Bitwise
(Note: This is not financial advice. Crypto is volatile; always DYOR and only invest what you can afford to lose.)
Read More